
This post is an update on the Hawaiian Landscape Evolution project. Read the previous post if first if you haven’t already, otherwise this one might not make sense.
The difference in environment across the Kohala Peninsula from east to west is striking:
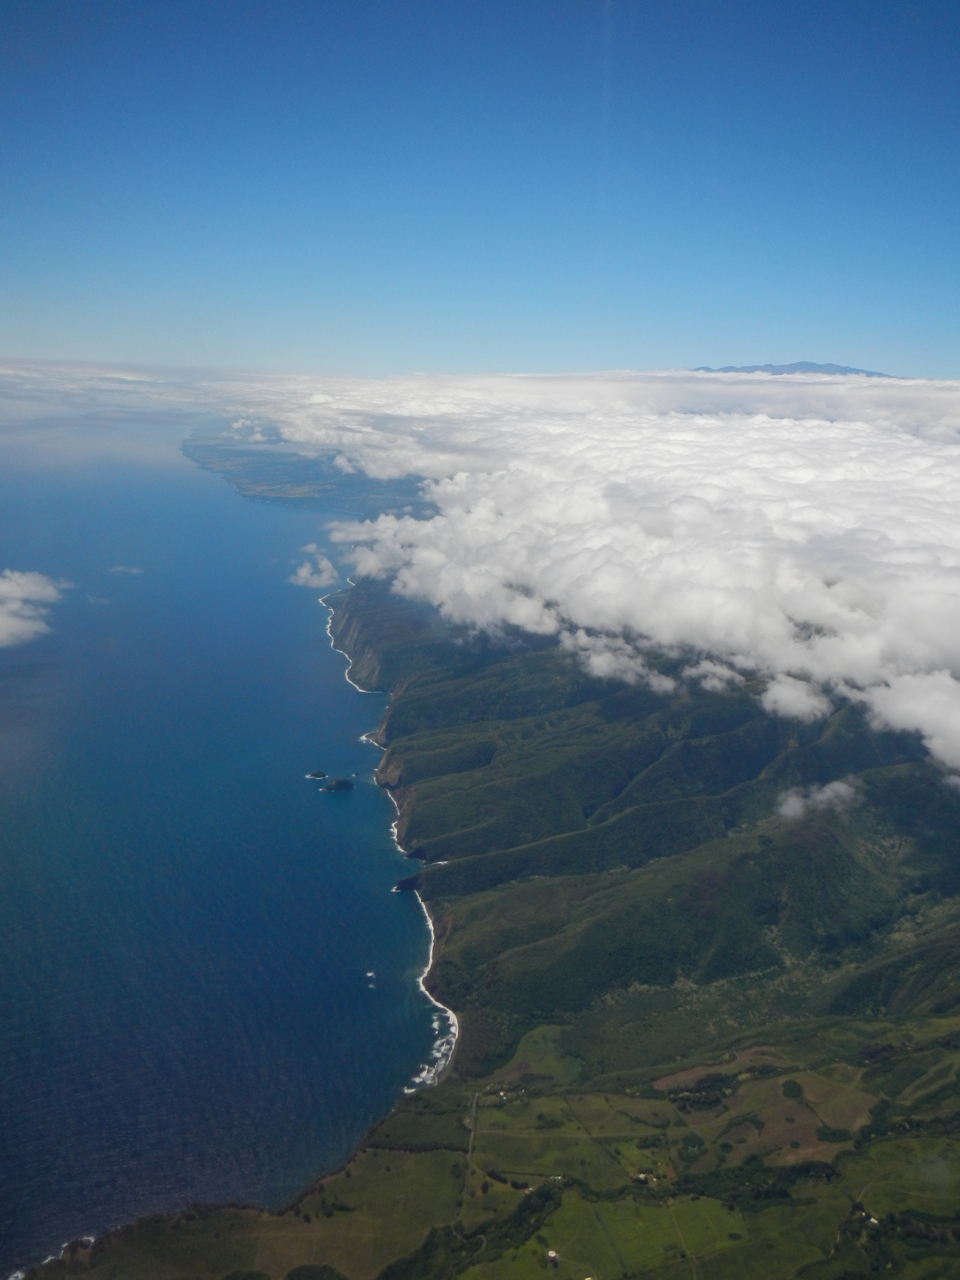
Aerial view of the “wet side” of the Kohala Peninsula, where clouds pile up and dump their moisture due to the orographic effect. The wet side is home to dense rain forests and towering waterfalls. The Kohala sea cliffs (450m tall) formed as a result of a 20km-wide landslide ~250,000 years ago. Mauna Kea rises from the clouds on the horizon.

Aerial view, looking south, of the transition between the wet and dry sides of the peninsula.
Soon after my arrival on Hawaii last week, we drove north out of Kona into a desert landscape, dotted with vacation communities along the coast. These plots represent a mainlander’s stereotypical view of what a Hawaiian vacation is like:
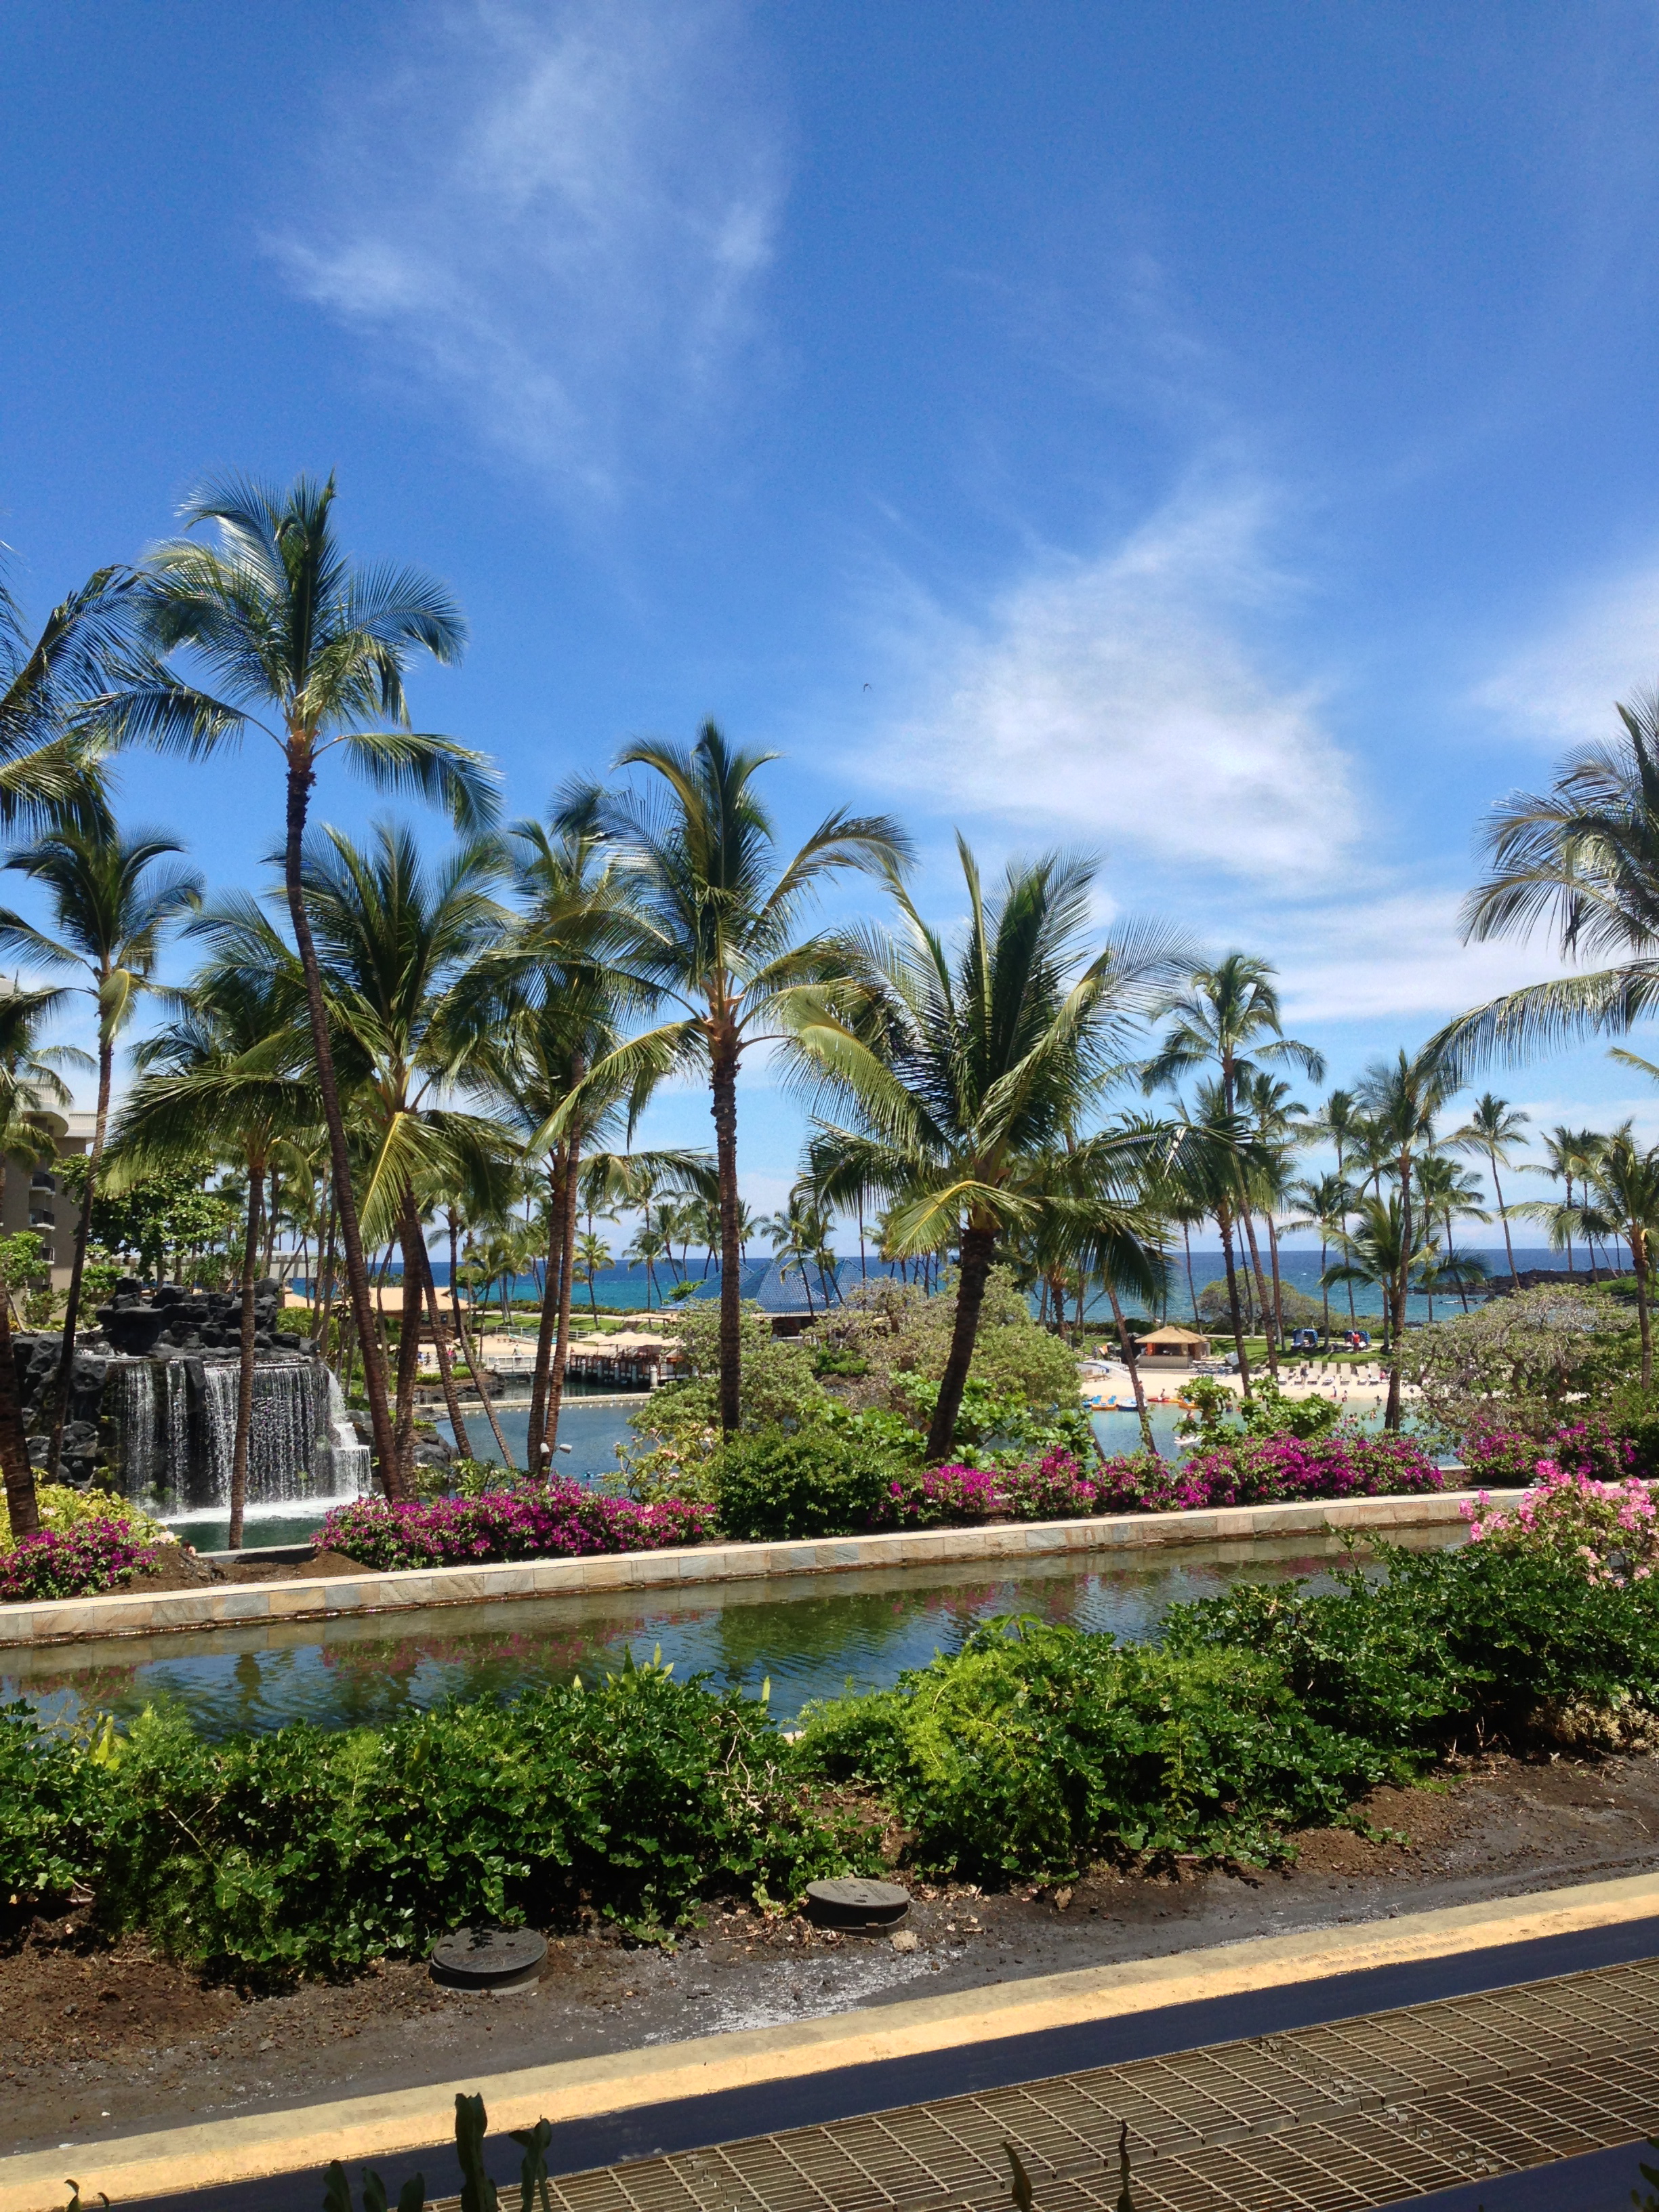
Waikoloa
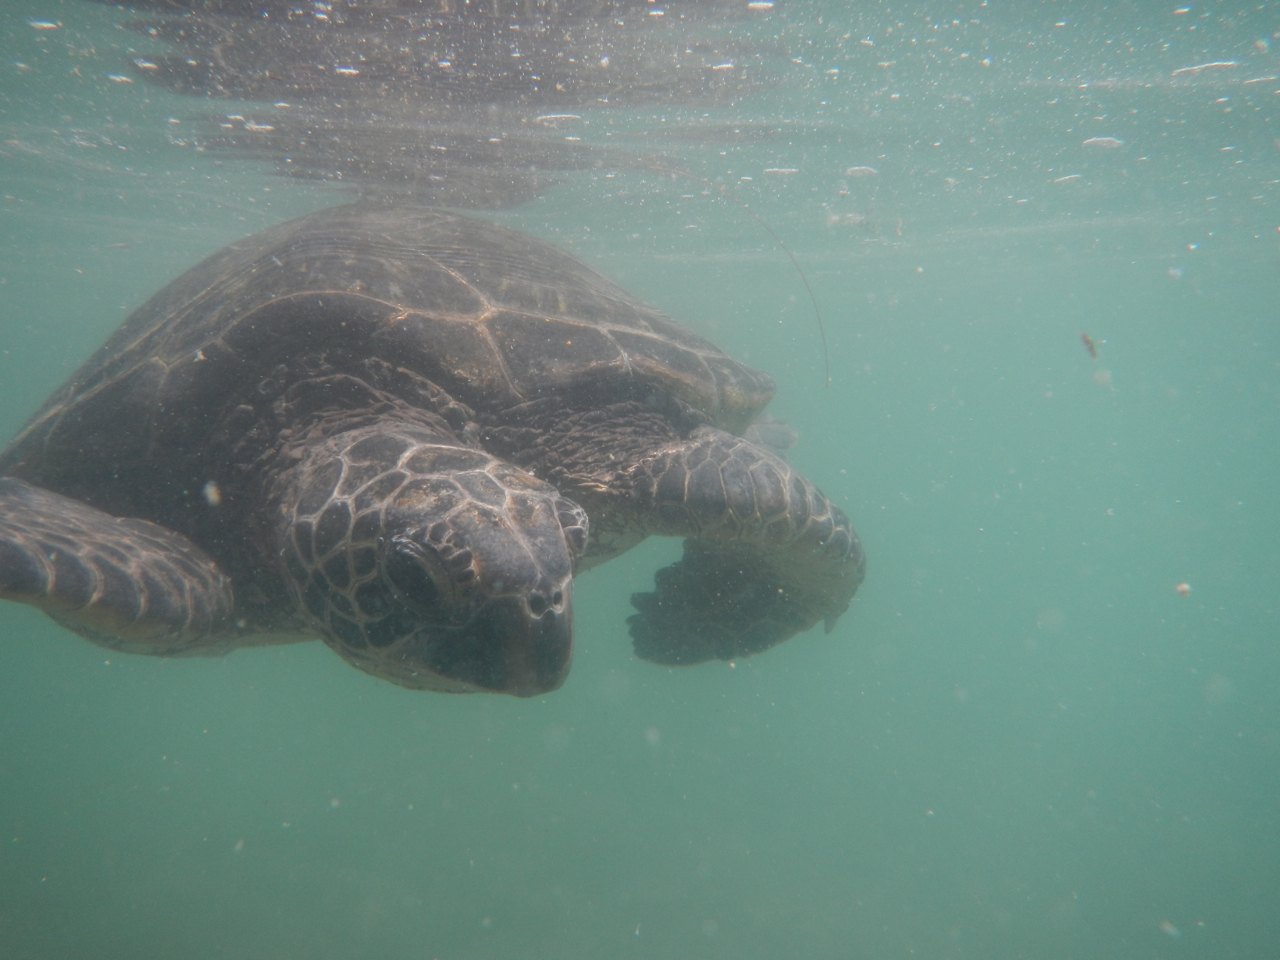
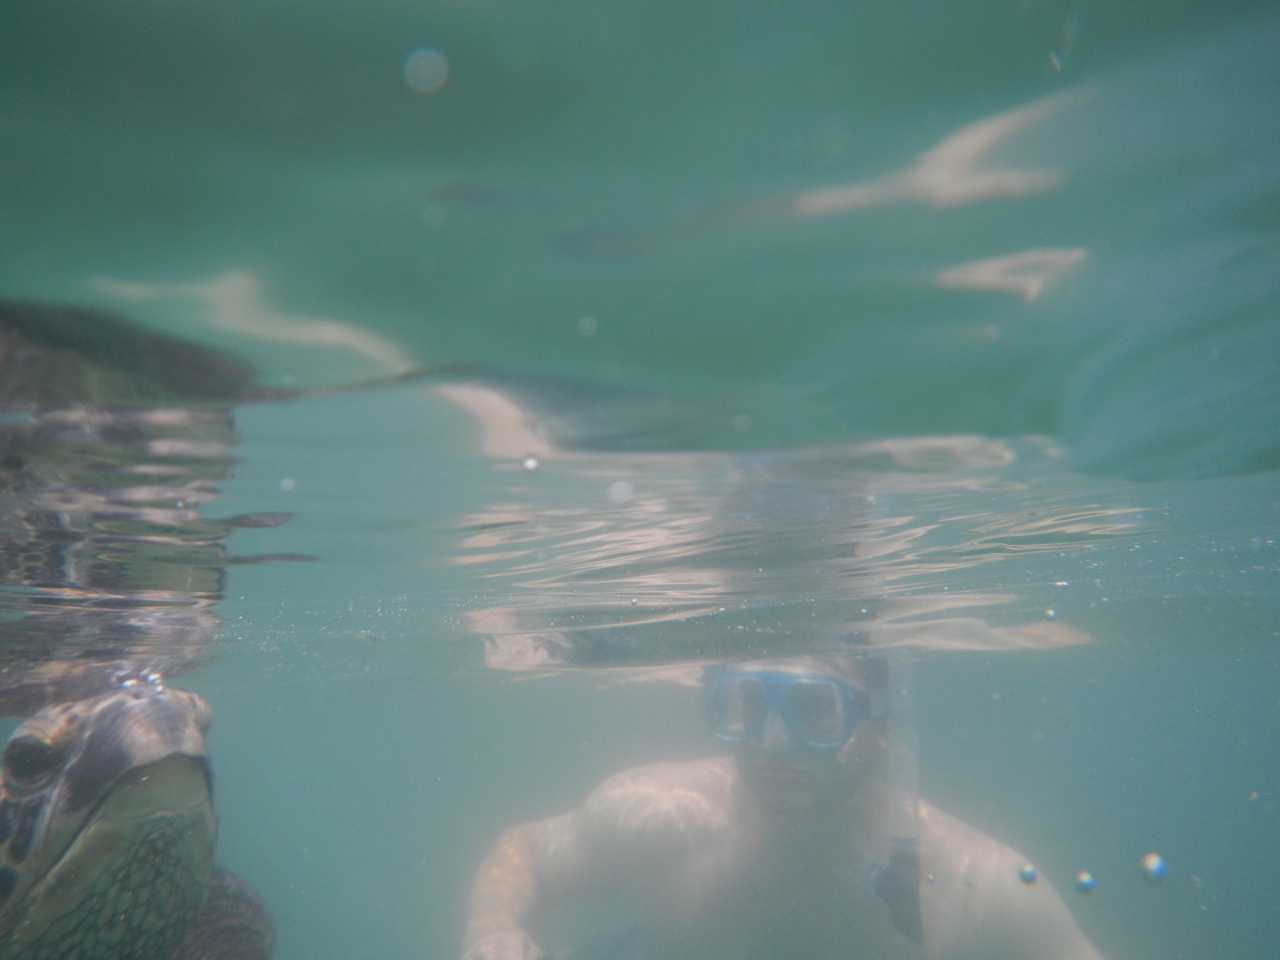
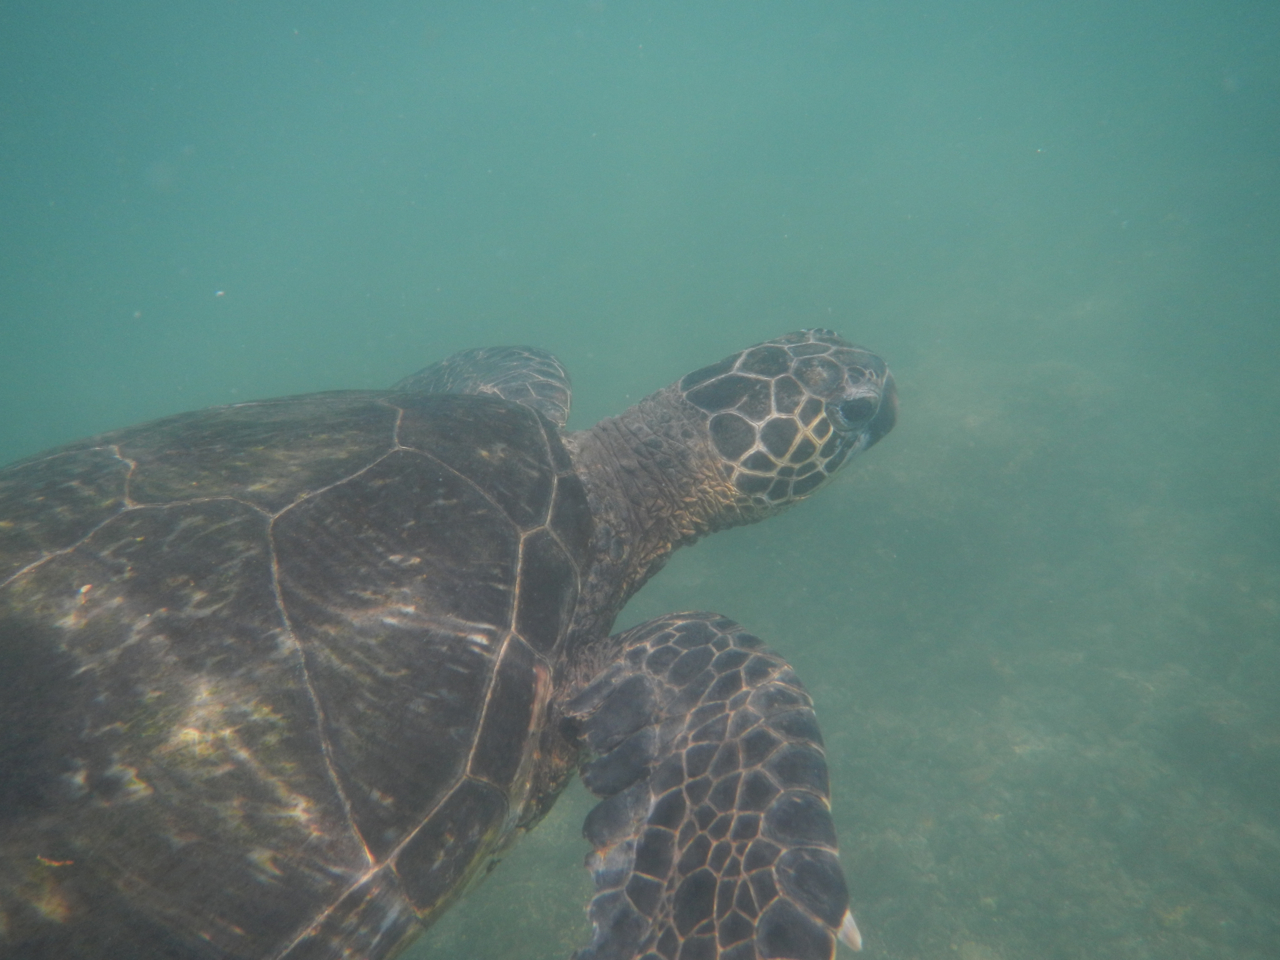
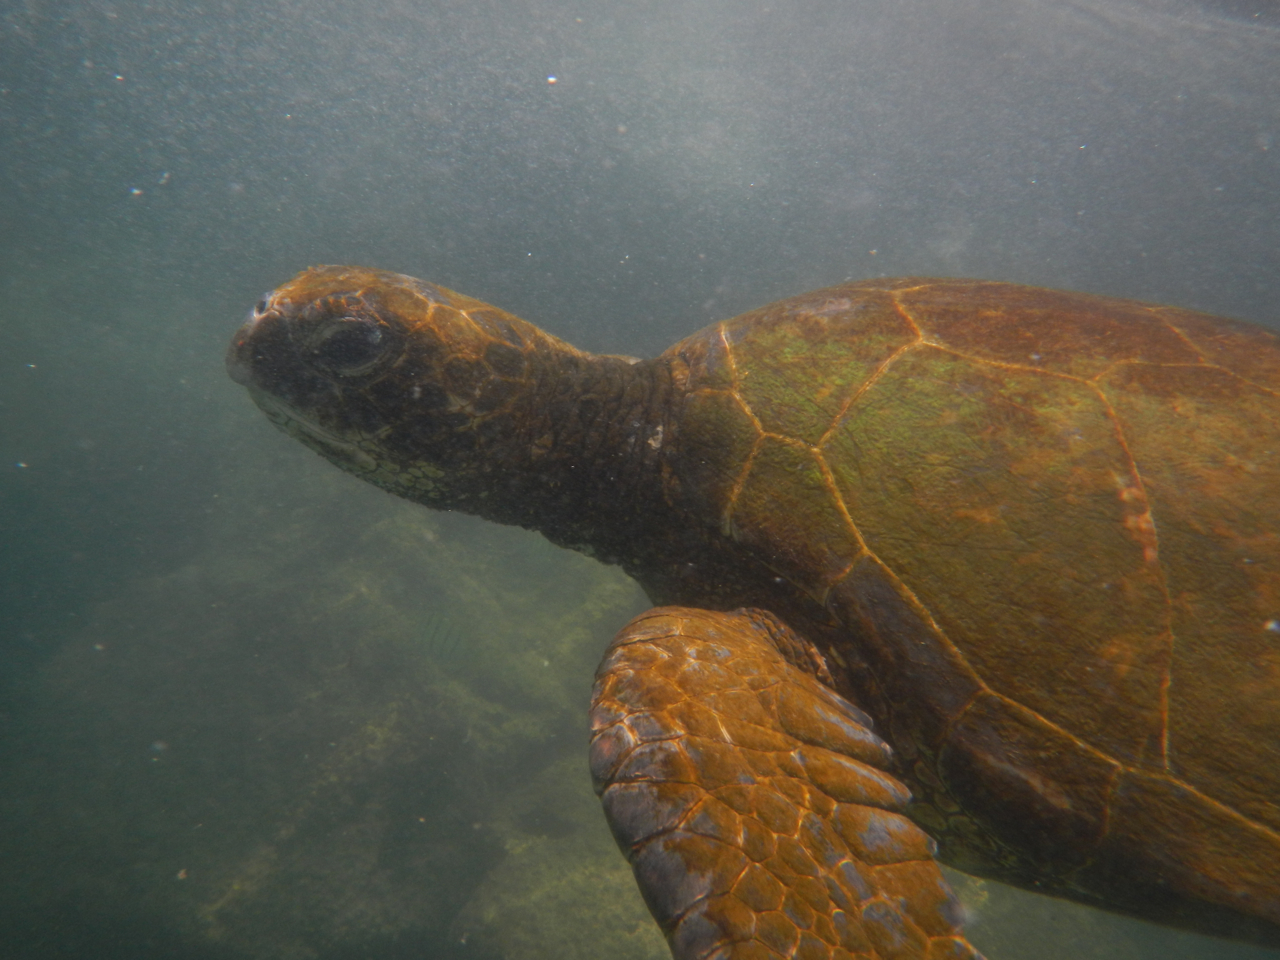
We chilled out with some sea turtle amigos at Waikoloa…

We were lucky enough to meet up with Brendan’s aunt, uncle and cousin to have a day off with them at one of these resorts on Sunday. Many thanks to them for treating us to an awesome time. The beach resorts along the dry side coast are there in spite of the geology – rugged, a’a basalt lava flows. The terrain reminds me of the San Francisco volcanic field of northern Arizona.

Driving across the dry side, looking out at Maui – Haleakala volcano on the horizon.

Brendan walks makai (toward the sea, in Hawaiian) on the dry side, where temperatures average 95F and rainfall is commonly less than 12 inches.

Brendan inspects sediment in Puanui channel that was recently reworked by catastrophic flooding caused by a big storm event in May – not a common occurrence for the dry side.
We are now sitting at the Kohala Coffee Mill Cafe in Hawi Town, taking the morning to synthesize some data that we’ve collected over the past week that I’ve been here. It’s a nice break from chopping through the jungle with a machete. We’re staying here in Hawi Town for the duration of the project. The town sits on the edge of the rain shadow on the Kohala Peninsula, so the climate is a happy medium between wet and dry.
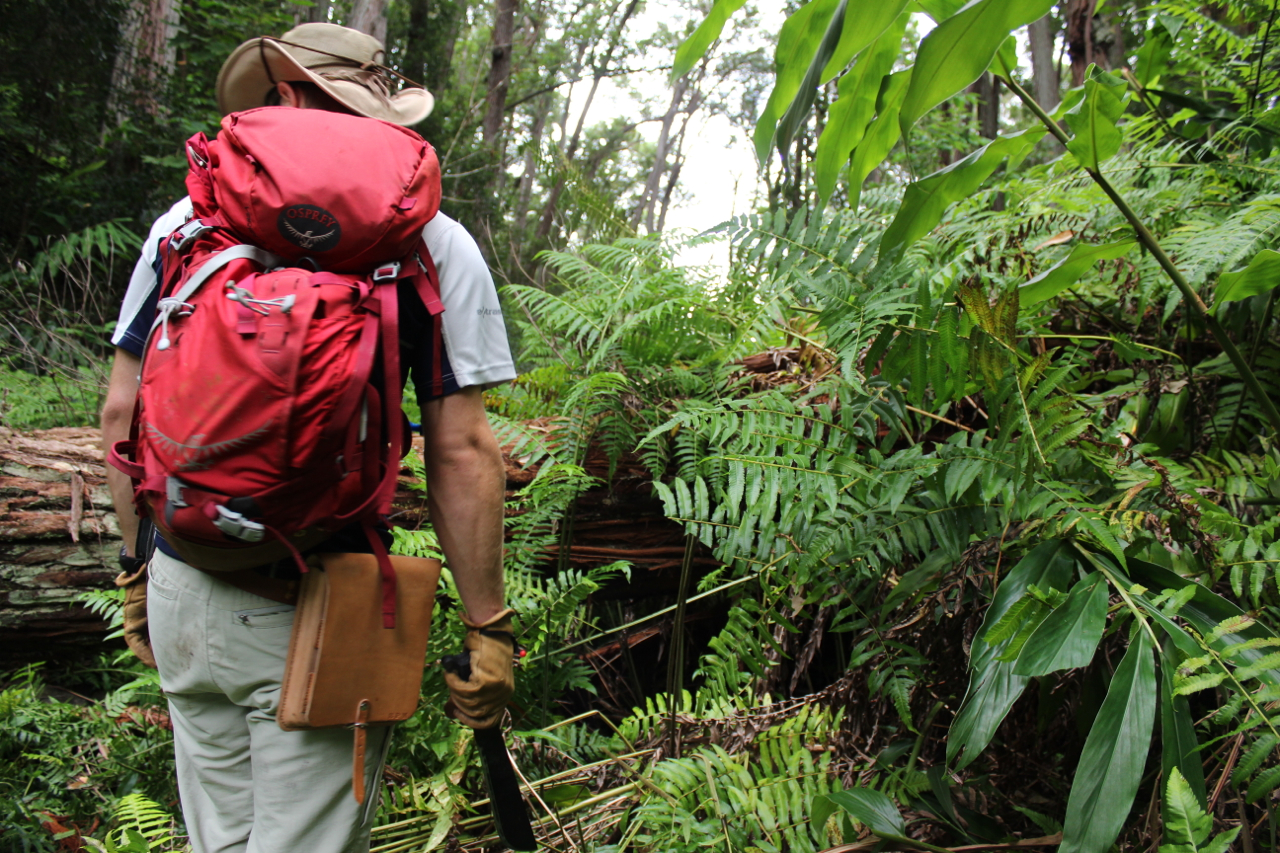
Brendan takes point with the machete to forge a path through the dense overgrowth in Waianaia channel on the wet side. The channel was flowing in previous field seasons during Brendan’s research, so this is new territory.
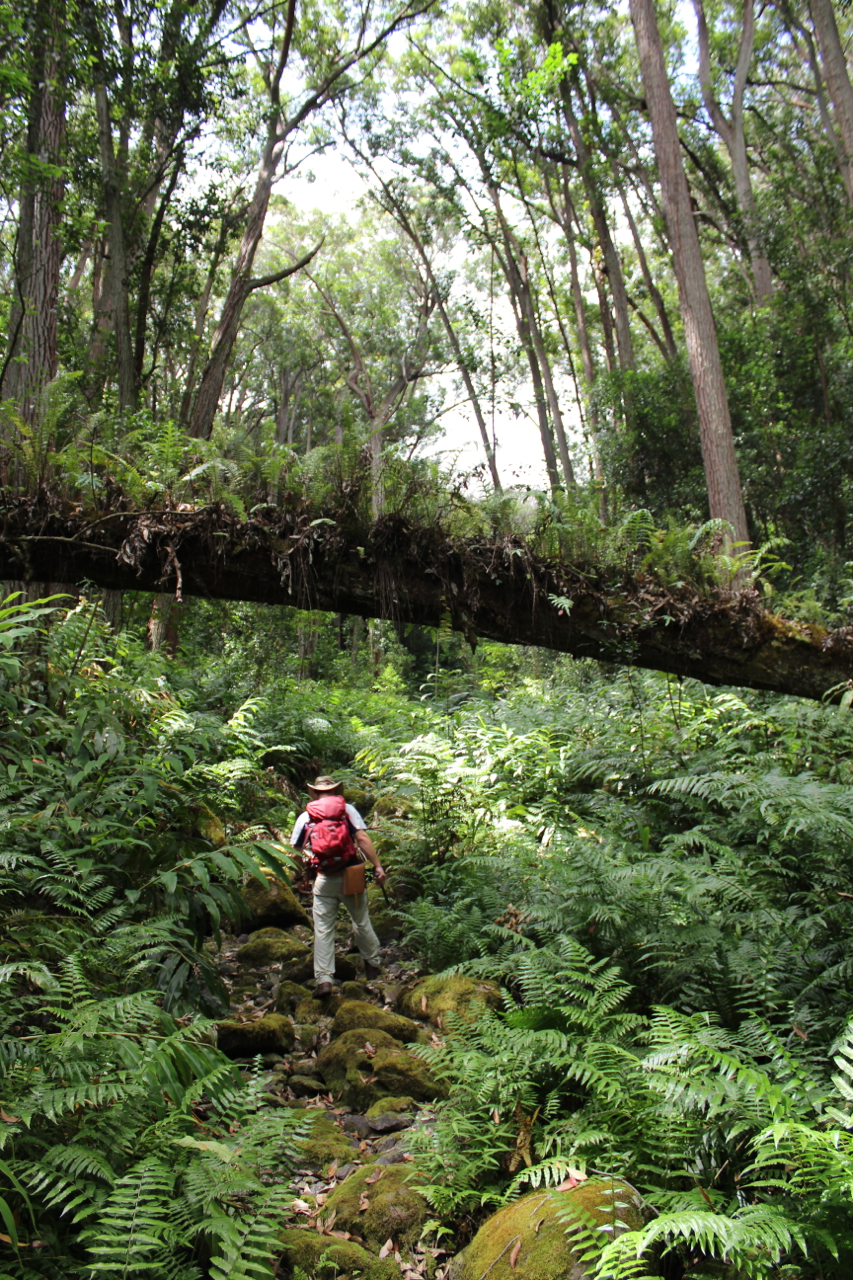
Waianaia Channel

Much of the work takes place in seaside cattle country.

A rain gauge!

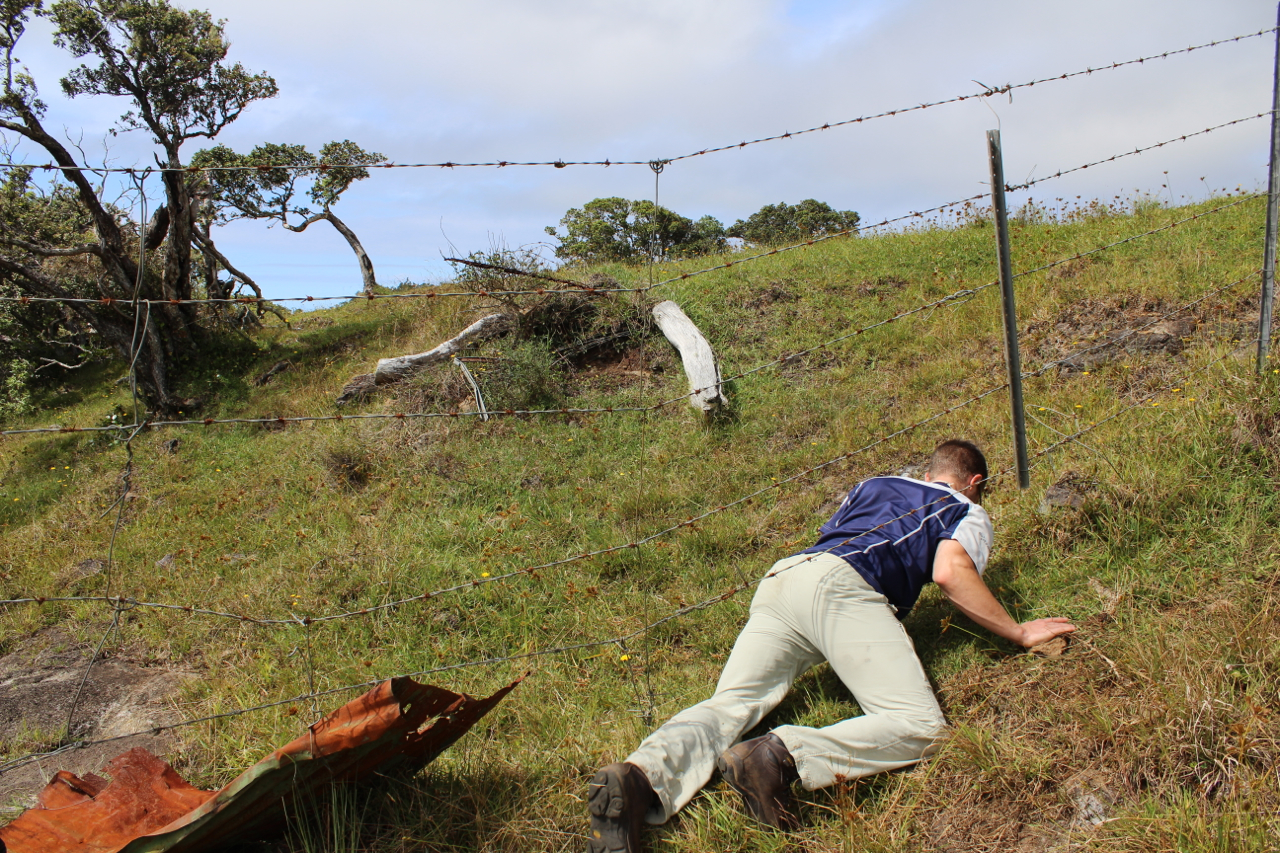
Brendan executes a classic exercise in geology.
So, what have we been doing so far in terms of science? I mentioned previously the goal of quantifying the effects of climate on erosion, so we have been collecting numerical data in the stream channels on either side of the peninsula in a few different ways. Brendan has previously installed three pieces of equipment in the main channels that we are working to describe:

Which of these does not belong?

Not a piece of basalt, but a concrete cobble made to imitate its natural counterpart. A readable RFID chip that can be tracked with an RFID detector sits inside the artificial rock. Installing these “better-than-average” rocks in the channel allows us to track how far sediment is transported in the channel, coupled with measurements of rainfall and streamflow.

A protective PVC housing shelters a pressure transducer: this device measures water pressure during streamflow, which can then be used to calculate the shear stresses on the bed – more useful numerical data that describes sediment transport in the channel.

Erosion pins serve as a point of reference to measure the erosion of bedrock.
In addition to the installed equipment, we conduct measurements on the ground ourselves. “Point counts” give us an idea of the distribution of sediment grain sizes and how far they have been transported by flowing water. I find it funny that I am doing point counts now because my Swedish friend, Thea, jokingly described what I do as “counting the stones”. Yep, that’s what I’m doing.
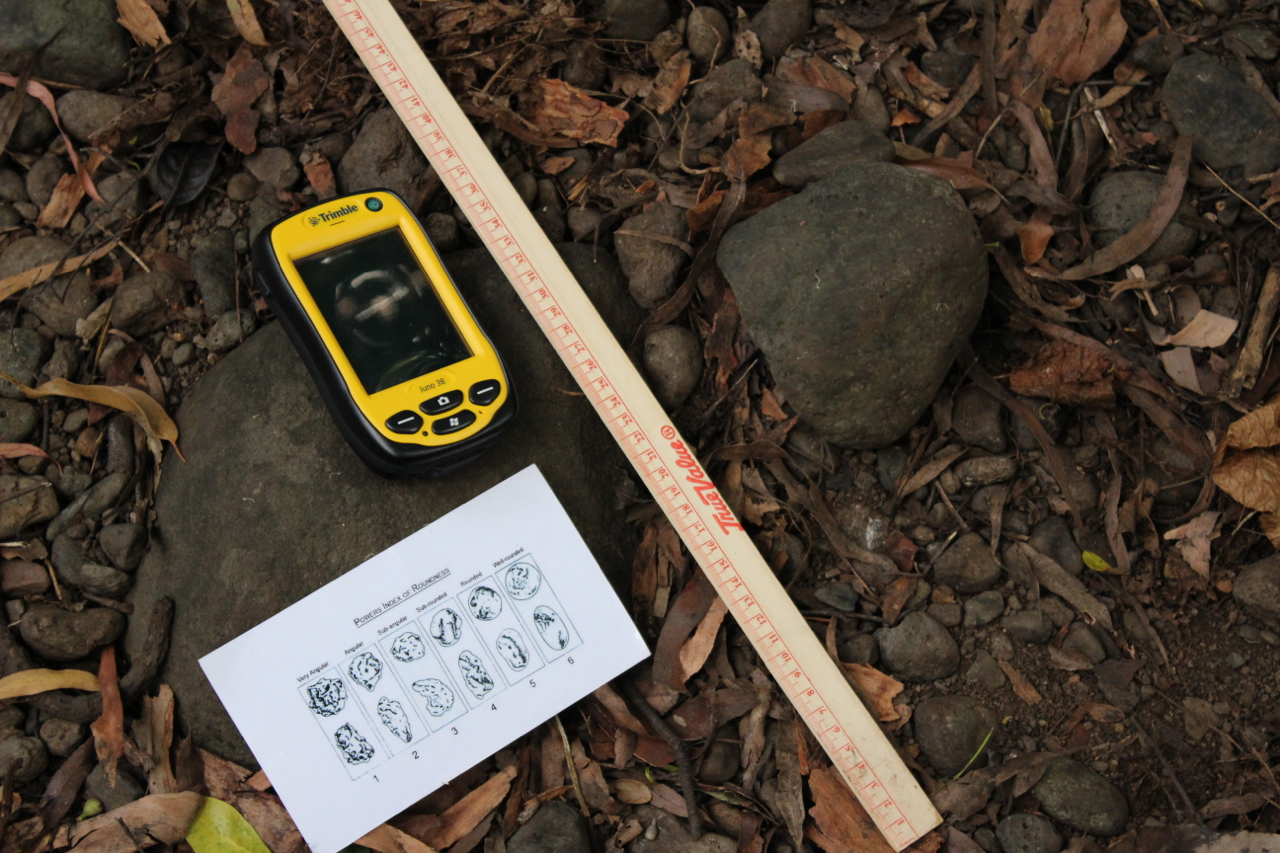
A point count involves randomly selecting 300 rocks in the channel, measuring them, describing their degree of rounding, and recording them in the GPS unit shown in the photo.
Another tool we have been using is called the Schmidt hammer. This is a spring-loaded hammer that strikes bedrock and measures the rebound of the hammer off the rock. This reading corresponds to rock strength, which is an important factor in describing erodibility of channels.

Brendan pushes the Schmidt hammer into bedrock at the base of a waterfall.
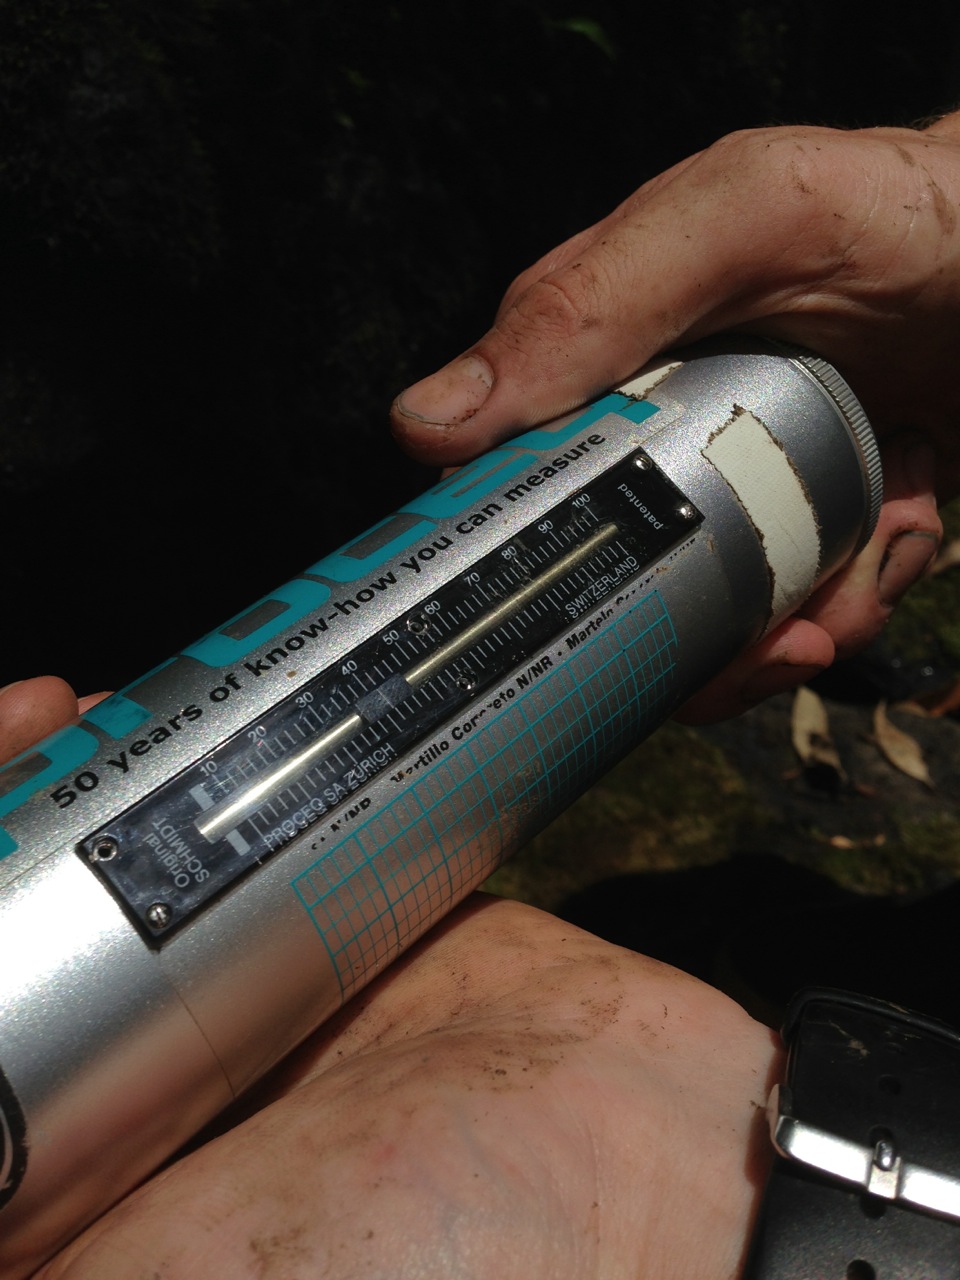
Taking a Schmidt hammer reading. The rebound value for this rock was 42 – the answer to the ultimate question of life, the universe, and everything.
Among the many activities on slate for the next few weeks: more point counts, Schmidt hammer transects, and a trip up into Pololu valley to investigate the geology there.

Brendan looks up into Pololu Valley on the wet side. We plan to hike up the ridge on the left later this month.
Stay tuned for more photos, geology and adventures. Follow @KLKgeo and the hashtag #HIgeo2013 on Instagram/Facebook for live updates from the field.
Aloha!
[For more about this project, read: Lasers, Drills, and Ukuleles]

Pingback: Lasers, Drills, and Ukuleles | KLKgeo·
Pingback: Hawaiian Landscape Evolution | KLKgeo·
Pingback: Hunting Waterfalls on Kohala | KLKgeo·